The best online cron job tools for Linux generally fall into two categories. Category A includes cron expression generators and testers that help you create and verify the correct schedule, such as 0 22 * * *. Category B includes cron monitoring services that check whether your scheduled job actually ran and alert you when it fails or stops reporting.
This guide covers both categories, starting with tools for creating and testing cron schedules, followed by services for monitoring cron jobs after they are deployed on Linux. The generated schedule can then be added to your existing crontab using crontab -e. If you are running cron jobs on a VPS, our Verpex review covers its VPS options for this type of setup.
Category A: Online Cron Generators & Expression Testers
These tools do one job well: turn a schedule you describe in your head into a correct five-field cron expression, and let you check it before it ever touches a production crontab. Nothing to install, you just copy the string it gives you.
1. Crontab.guru
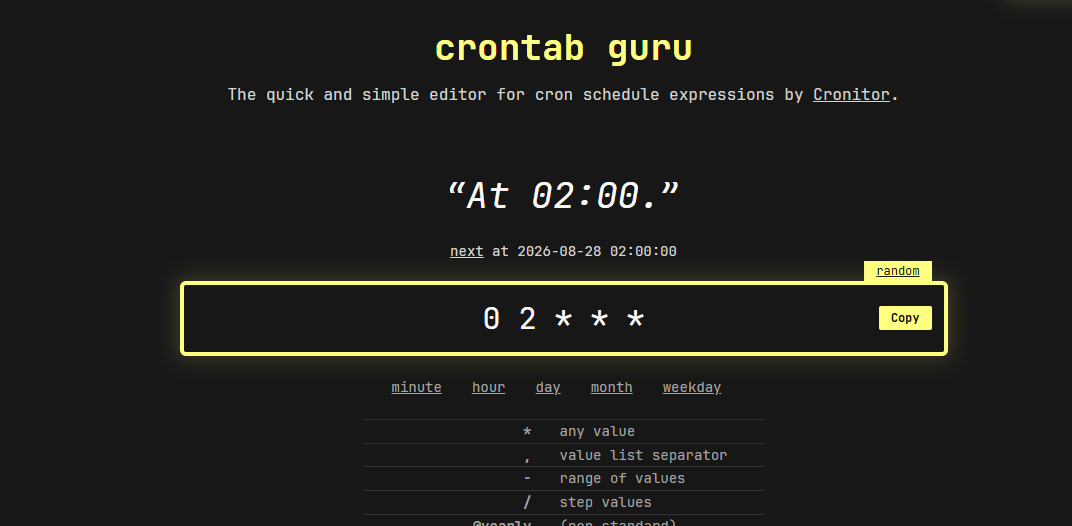
Crontab.guru, type an expression and get an instant plain-English translation with next run times.
Tool Category: Online Cron Expression Generator & Tester
Key Features:
- Plain-English translation of any cron expression as you type
- Next scheduled run times shown live, no submit button needed
- Field-by-field syntax highlighting so you can see which part of the expression you are editing
- No signup, no account, works entirely client-side in the browser
- Shareable permalink for a specific expression, useful for documenting a schedule in a ticket or wiki page
How It Works:
- Type or paste a cron expression into the single input field on the site
- Read the plain-English translation and the list of upcoming run times to confirm it means what you think it means
- Copy the validated expression and paste it into your crontab
The actual interface shows a plain-English translation above the expression and the next scheduled run below it, this is roughly what you'd see for a 2 AM daily job:
Once you're happy with it, tack your actual command onto the expression it gives you:
0 2 * * * /opt/scripts/backup.sh2. CronMaker
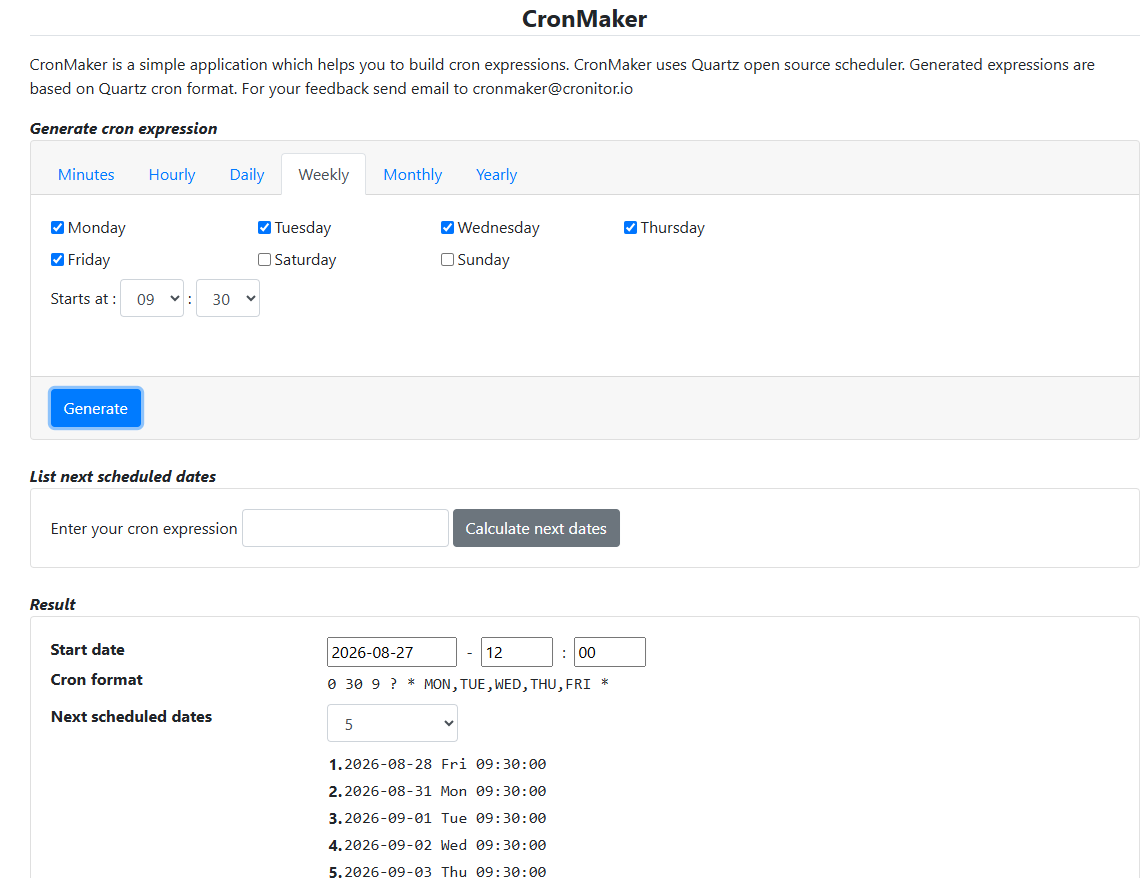
CronMaker, a dropdown builder that outputs both standard cron and Quartz-style expressions.
Tool Category: Visual Cron / Quartz Schedule Builder
Key Features:
- Dropdown-based builder, no need to type raw cron syntax at all
- Generates both a standard five-field cron string and a six-field Quartz expression side by side
- Calendar-style preview of the next several scheduled run times
- Supports every-N-minutes, specific-day-of-week, and last-day-of-month patterns without hand-writing the syntax
If your job only needs to catch up after a missed reboot window rather than run on a strict schedule, it's worth comparing against anacron before you build the cron expression at all.
How It Works:
- Pick a frequency pattern from the dropdown menus (minutes, hours, specific days, or a custom recurrence)
- Preview the generated expression and confirm the next five run times match what you expect
- Copy the standard cron string, not the Quartz string, into your Linux crontab
The real interface has a tab bar for how often the job runs, a Weekly tab here since the job needs specific weekdays, plus a Result panel underneath showing both the Quartz format CronMaker generates natively and the standard cron string you actually paste:
Grab the standard cron line, not the Quartz one, and add your command:
30 9 * * 1-5 /opt/scripts/send-report.sh3. Crontab Generator
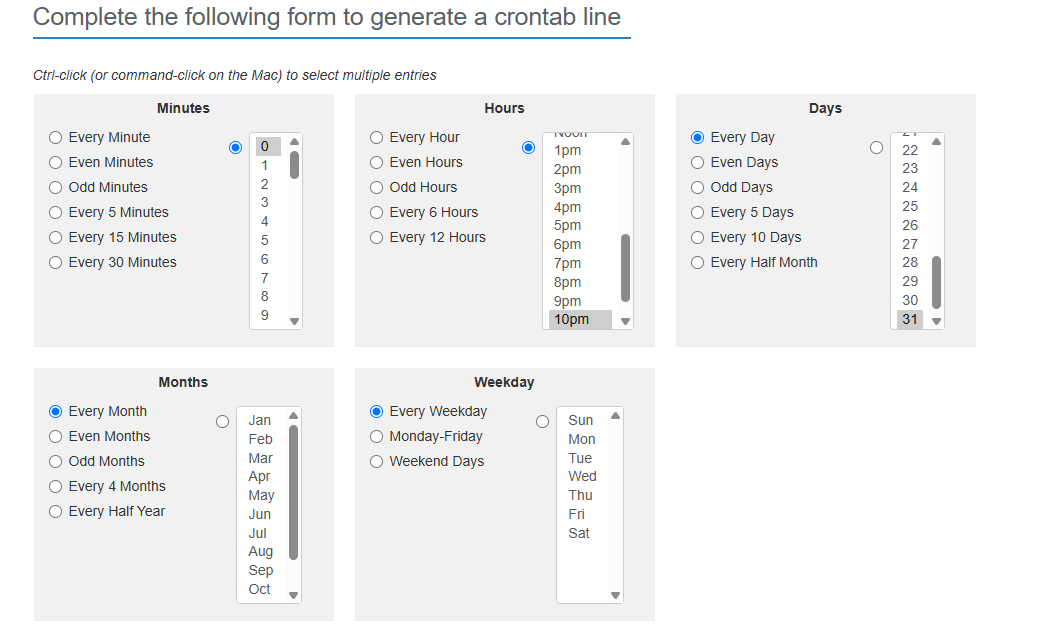
Crontab Generator, a multi-select field builder that outputs a ready-to-paste crontab line.
Tool Category: Online Cron Expression Generator (Multi-Select Field Builder)
Key Features:
- Multi-select list boxes for minutes, hours, day of month, month, and weekday, no raw syntax typing needed
- Quick preset buttons like "Every 15 Minutes" or "Monday - Friday" for common patterns
- A dedicated Command field, so the generated line already includes your script path
- Built-in options for handling execution output: mute it, save it to a file, or email it
- Free, no signup, runs entirely client-side in the browser
If you are choosing between cron and systemd timers in the first place, build the expression here first, since the same schedule string works for either once you know it is correct.
How It Works:
- Ctrl-click (Cmd-click on a Mac) to select values in each schedule column, or use one of the preset buttons above a column
- Enter the command to execute in the Command field below the schedule builder
- Copy the generated crontab line from the bottom of the form
Copy that line straight into your crontab:
0 22 * * * /opt/scripts/cache-clear.shCategory B: Cloud Cron Job Monitoring & Health Tracking
A correct schedule tells you nothing about whether the job actually ran. These dashboards watch for a ping from your job and alert you the moment one goes missing, which is the only way to catch a job that hangs, never starts, or exits 0 without doing anything. Setup is still just copying one generated line, this time it goes at the end of your existing command instead of replacing it.
4. Healthchecks.io Cloud
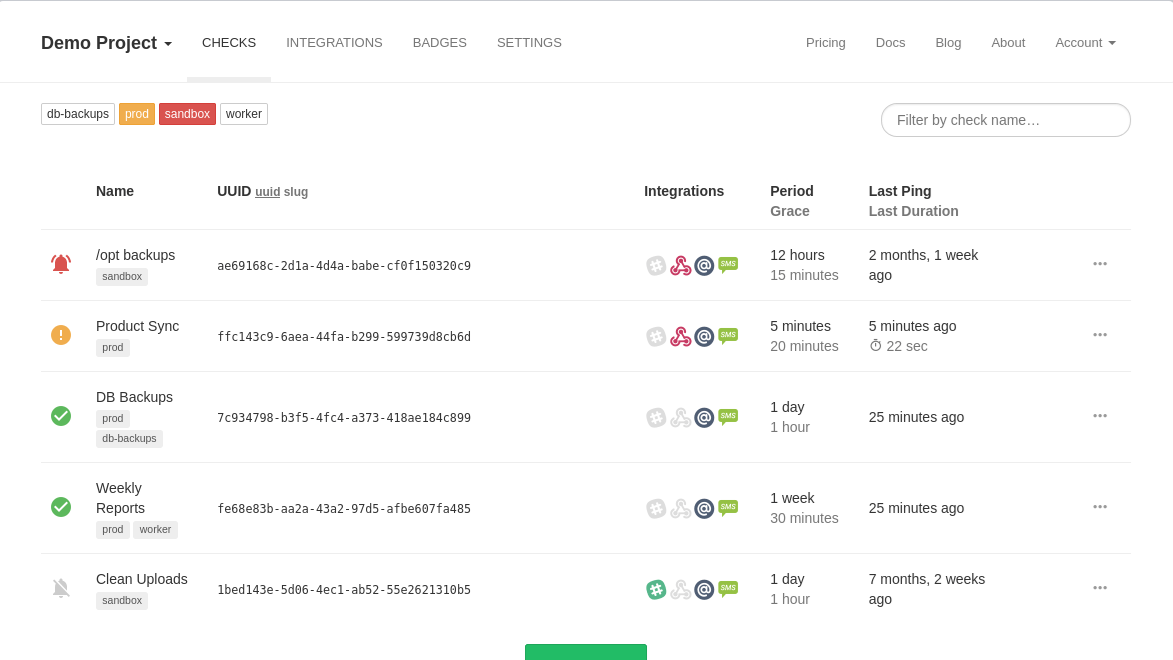
Healthchecks.io, the hosted dashboard's check list view, with each row showing last ping time and status.
Tool Category: Cloud Heartbeat / Cron Job Monitoring Dashboard
Key Features:
- Unique ping URL per check, generated instantly from the dashboard
- Configurable grace period so an occasionally-slow job does not trigger a false alert
- Explicit
/failendpoint to signal a known failure instead of relying only on a missed ping - Email, Slack, Telegram, PagerDuty, and 20+ other alert integrations
- Free hosted tier covers 20 checks with three months of log history
This is the tool we'd point you to first if the job you're watching is a server backup running on a schedule, since silent backup failures are exactly the failure mode heartbeat monitoring was built for.
How It Works:
- Create a check in the dashboard and set its expected schedule and grace period
- Copy the generated ping URL and append it to the end of your existing crontab line
- Get alerted through your chosen channel the moment a scheduled ping does not arrive
The dashboard gives you a URL. You paste it onto the end of the job you already have, so the ping only fires if the job exits 0:
0 2 * * * /opt/scripts/backup.sh && curl -fsS -m 10 --retry 5 https://hc-ping.com/your-uuid > /dev/nullProduction Tip:
5. Cronitor.io
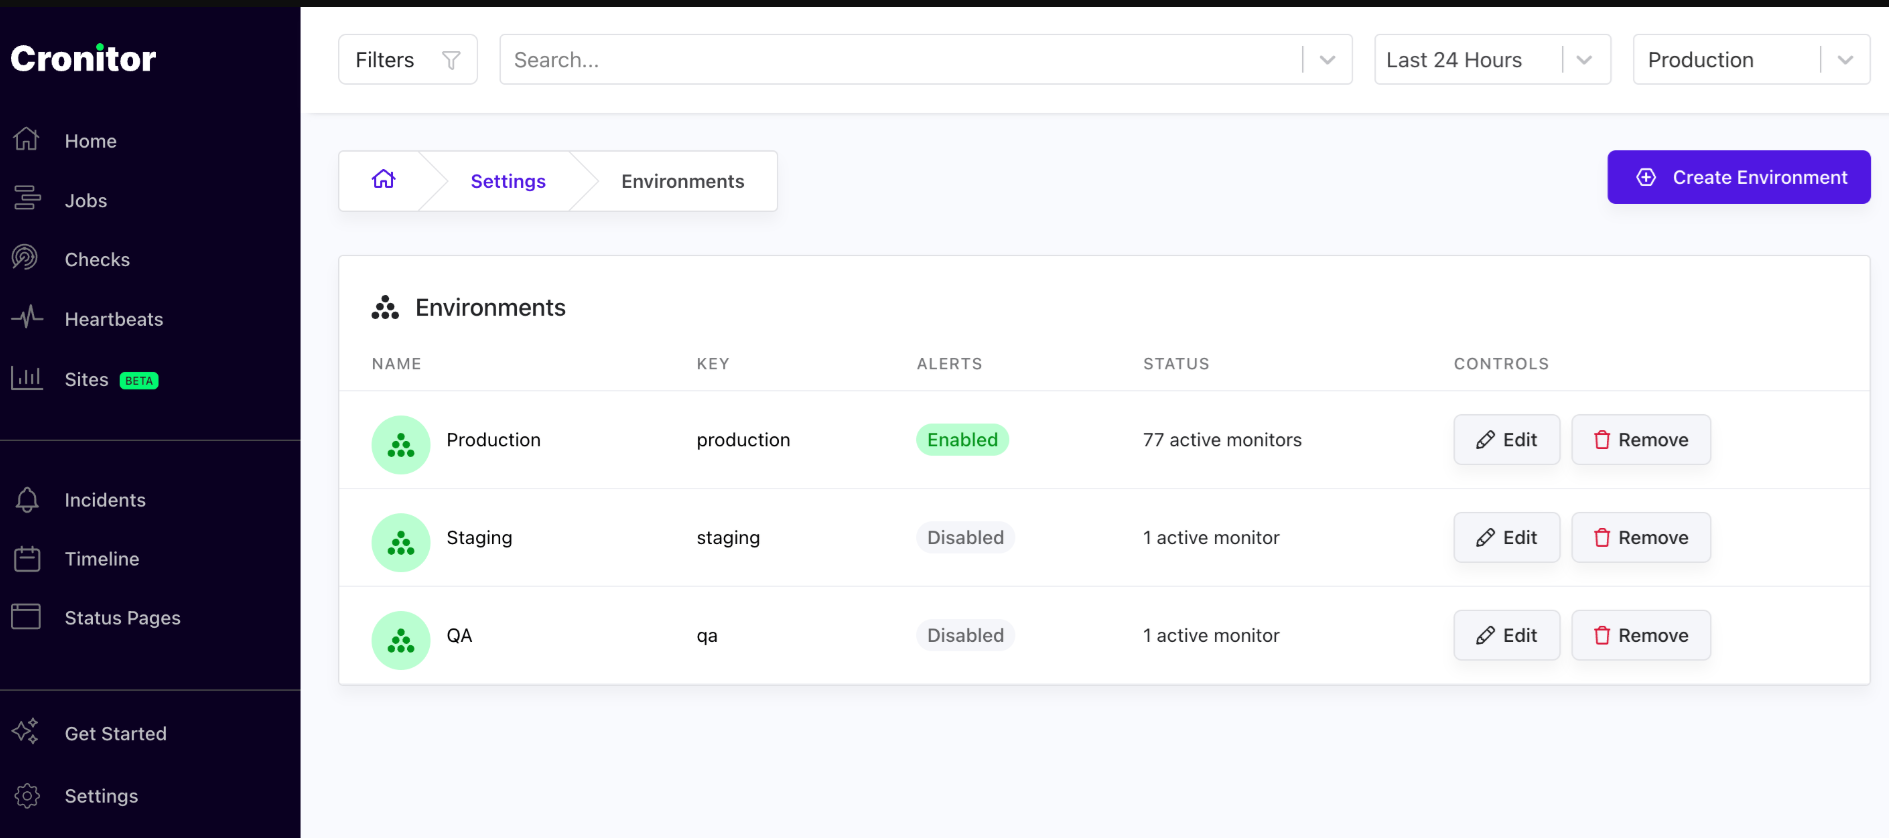
Cronitor, schedule-aware analytics with a duration trend chart per job.
Tool Category: Cloud Cron Monitoring & Schedule Analytics Dashboard
Key Features:
- Parses your actual cron expression, so it knows what "on time" means for that specific job rather than a fixed interval
- Tracks run duration trends over time and flags gradual slowdowns before they become outages
- Calendar-style history view that surfaces recurring failure patterns at a glance
- Native support for Kubernetes CronJobs alongside traditional crontab jobs
- Dashboard-generated wrapper line that reports exit code and runtime automatically
Pairs well with an automated backup script where you also want to know if the job is quietly getting slower over weeks, not just whether it ran.
How It Works:
- Create a monitor in the dashboard and let it read the job's cron expression
- Copy the wrapper line the dashboard generates and swap it in for your existing crontab command
- Review duration trends and calendar history in the dashboard to catch slow degradation early
The generated line wraps your existing command instead of appending to it:
0 2 * * * cronitor exec MONITOR_KEY /opt/scripts/backup.sh6. Dead Man's Snitch
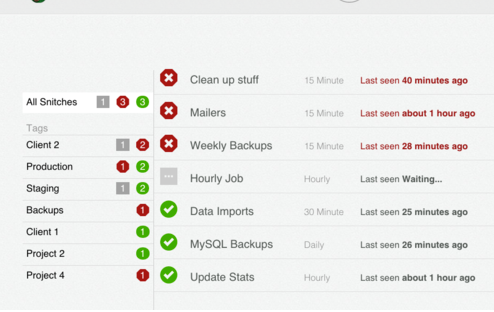
Dead Man's Snitch, a minimal dashboard listing each snitch and when it last checked in.
Tool Category: Cloud Dead Man's Switch Dashboard
Key Features:
- One unique URL per snitch, created in under a minute with no configuration beyond a name and interval
- Custom check-in interval per snitch instead of a fixed set of tiers
- Email, Slack, PagerDuty, and webhook alerting from the entry paid plan up
- Mobile app for iOS and Android showing live status of every watched job
How It Works:
- Create a snitch, give it a name, and set the expected check-in interval
- Copy the generated URL and append it to the end of your crontab line
- Get notified the instant a check-in is missed
The free plan ("The Lone Snitch") covers exactly one job, and the URL it gives you gets appended the same way:
30 1 * * * /opt/scripts/rotate-logs.sh && curl -fsS -m 10 --retry 5 https://nosnch.in/YOUR_SNITCH_TOKEN7. UptimeRobot
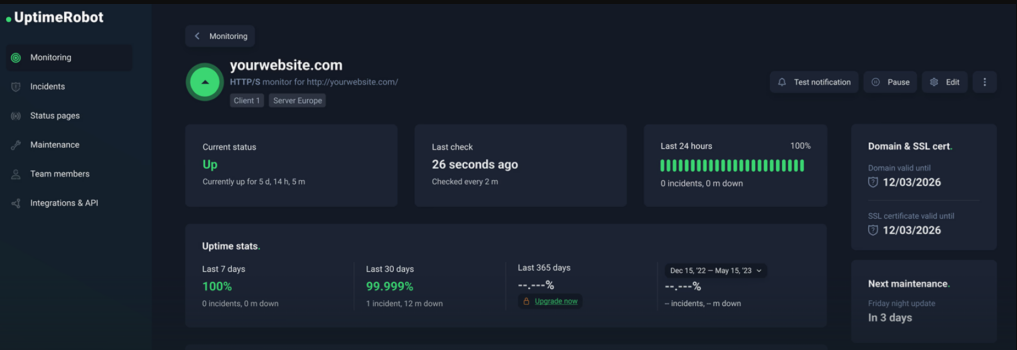
UptimeRobot, heartbeat monitors sit in the same dashboard as regular uptime checks.
Tool Category: Cloud Uptime & Heartbeat Monitoring Dashboard
Key Features:
- Heartbeat monitor type available alongside standard HTTP, port, and keyword checks
- Free plan covers a generous number of monitors, including heartbeats, in one dashboard
- Email, SMS, Slack, and webhook alerting
- Same dashboard as any existing website uptime checks, so nothing extra to log into
If you're weighing this against a broader set of options, our roundup of Linux monitoring tools covers server-level monitoring beyond just cron heartbeats.
How It Works:
- Create a heartbeat monitor and set the expected check-in interval
- Copy the generated URL and append it to the end of your job's crontab line
- Get alerted through your chosen channel when a check-in is late or missing
15 4 * * * /opt/scripts/report.sh && curl -fsS -m 10 --retry 5 https://heartbeat.uptimerobot.com/YOUR_HEARTBEAT_IDCompatibility Note:
UptimeRobot's terms around commercial use of the free plan have changed more than once in recent years. If you are monitoring a revenue-generating job rather than a personal project, check the current terms on their pricing page before relying on the free tier long term.
8. cron-job.org
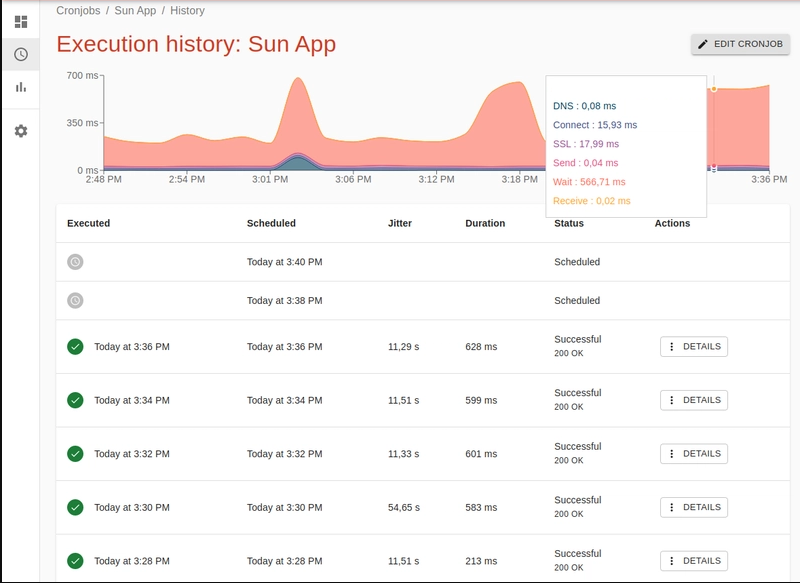
cron-job.org, schedules and triggers the HTTP request itself, with execution history per run.
Tool Category: Cloud Cron Job Scheduler & Execution Dashboard
Key Features:
- Schedules and triggers HTTP requests directly from their cloud infrastructure, no local cron daemon required for the job itself
- Free with no functionality gated behind a paid tier
- Per-job execution history including HTTP response codes and timing
- Good fit for triggering a web app's scheduler endpoint, a cache clear, or a webhook on a schedule
How It Works:
- Add the target URL and desired schedule directly in the dashboard, no crontab entry needed at all
- cron-job.org calls that URL from the cloud at the scheduled time
- Check the dashboard's execution history for response codes and timing on every run
This one is the exception on the list: there is no crontab line to copy, since the schedule and the trigger both live in the dashboard. The only thing you provide is the endpoint it should call:
https://yourapp.example.com/scheduler/run9. Better Stack
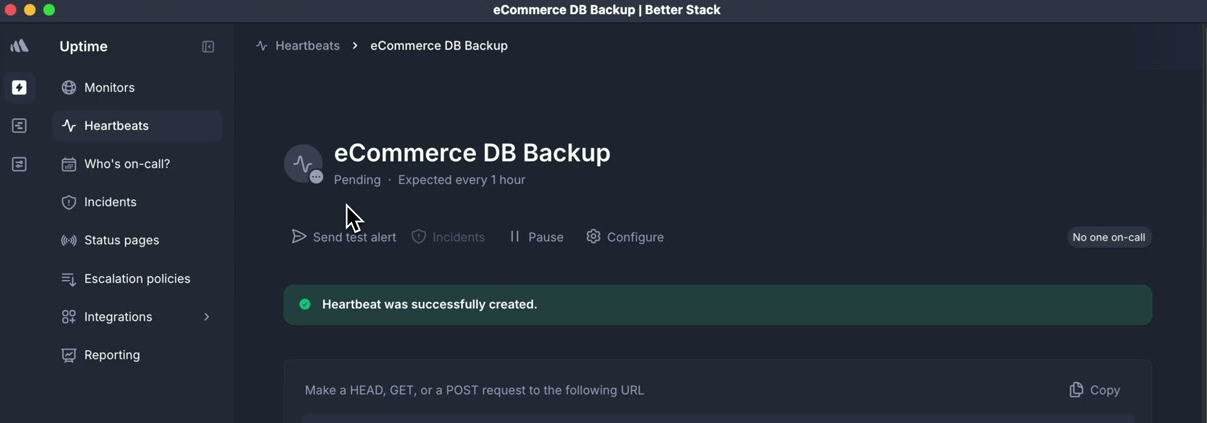
Better Stack, heartbeat checks sit alongside uptime, SSL, and incident management in one dashboard.
Tool Category: Cloud Uptime & Heartbeat Monitoring Dashboard (part of a broader observability platform)
Key Features:
- Heartbeat checks configurable down to 30-second intervals on paid plans
- Incidents from a missed cron job, a failed SSL renewal, and a downed endpoint land in one shared incident timeline
- Free tier includes 10 monitors and heartbeats
- Built-in on-call escalation and public status pages
Better Stack tells you a heartbeat went missing, not why. Pairing it with proper logging on the job itself is still worth doing so you can see what actually happened once the alert fires.
How It Works:
- Create a heartbeat monitor in the dashboard and set the expected interval
- Copy the generated URL and append it to the end of your job's crontab line
- Missed heartbeats land in the same incident timeline as your other monitors
0 3 * * * /opt/scripts/export.sh && curl -fsS -m 10 --retry 5 https://uptime.betterstack.com/api/v1/heartbeat/YOUR_KEYOnline Cron Job Tools - FAQ
Q1: What's the actual difference between a generator and a monitoring tool?
A generator like Crontab.guru or CronMaker only helps you build a syntactically correct schedule string. It has no idea whether your job ever actually runs. A monitoring tool like Healthchecks.io or Cronitor watches for a ping after the job finishes and alerts you if that ping stops arriving. Most setups use one of each: a generator once, to write the schedule, and a monitor continuously, to confirm it keeps working.
Q2: Do these online tools see my actual script or server?
Generators never see your server at all, they only process the expression string you type into the browser. Monitoring dashboards only see the single ping your job sends after it finishes, they do not have access to your script, its output, or your server unless you explicitly attach log data to the ping payload yourself.
Q3: Isn't MAILTO in crontab enough to catch a failed job?
Setting MAILTO only sends mail when cron itself captures output or a non-zero exit code. It does nothing if the job hangs indefinitely, the server reboots and cron never runs at all, or the script exits 0 while silently doing nothing, which is exactly the failure mode heartbeat monitoring catches. See our exit code guide for the underlying mechanics.
Q4: Will a server reboot or maintenance window trigger a false alert?
It can, if the grace period is shorter than your typical maintenance window. Most monitoring tools let you pause a check manually before planned maintenance, and setting the grace period a bit longer than the job's normal runtime variance absorbs an occasional late run without silencing real failures.
Which is the best online cron job tool for Linux?
There isn't a single winner, it depends on which half of the problem you're solving. For getting the syntax right, Crontab.guru is the fastest and simplest of the three generators covered here. For catching a job that silently fails, Healthchecks.io gives you the most generous free option built specifically for cron.
Conclusion
Generators and monitors solve different halves of the same problem. Get the schedule right first with a tool from Category A, since a monitoring tool cannot fix a wrong expression, it can only tell you the wrong expression ran on time. Then add a Category B dashboard so you actually find out when something breaks instead of discovering it from a customer complaint or a missing report. None of this replaces good exit code handling inside the script itself, it just makes sure you find out when that handling was not enough.
Our recommendations:
- Crontab.guru: Use this if you want the fastest way to sanity-check a cron expression with zero setup.
- CronMaker: Use this if you would rather build a schedule from dropdowns than write raw syntax by hand.
- Crontab Generator: Use this if you'd rather select values from lists than write raw syntax, and want the command baked into the output line.
- Healthchecks.io Cloud: Use this if you want the most generous free tier built specifically for cron and systemd timers.
- Cronitor.io: Use this if you want schedule-aware analytics and duration trend tracking.
- Dead Man's Snitch: Use this if you want the simplest possible dead man's switch and only need to watch one or two jobs on the free tier.
- UptimeRobot: Use this if you are cost-sensitive and have confirmed the current free-tier terms fit your use case.
- cron-job.org: Use this if your job is really just an HTTP endpoint you need triggered on a schedule.
- Better Stack: Use this if you already monitor uptime there and want cron checks on the same on-call rotation.
Did we miss a tool you rely on? Tell us in the comments below.
If this article helped, share it with someone on your team.
LinuxTeck - A Complete Linux Infrastructure Blog
LinuxTeck covers everything from beginner Linux commands to advanced Linux system administration and DevOps career guidance, written by practitioners for professionals working on Ubuntu, Rocky Linux, RHEL, and enterprise Linux environments every day.
Thank you for reading and for being part of this journey. If this article saved you time, consider buying me a coffee. Every contribution helps me keep producing in-depth, practical Linux content for readers like you.

Thank you for your endless support